b5 <- read_tsv("b5.tsv",
               show_col_types = FALSE)
go_away <- c("race", "age", "engnat", "gender", "hand", "source")
b5c <- b5 |> select(-any_of(go_away))animint2 GSOC Examination
Introduction
Hello! If you’re reading this, you’re probably Toby Dylan Hocking, Faizan Khan, or someone who’s applying to GSOC 2023. (And if you’re in the latter group, best of luck!)
Why am I applying to work on animint2? In my field of expertise—network psychometrics—an interactive model of depression led to the discovery of hysteresis in symptom networks. Later on, this became a crucial component of network theory.1 So I’ve become an enthusiast for interactive models and visualizations in science.
1 D. Borsboom. A network theory of mental disorders. World Psychiatry. 2017.
If I’m lucky, I hope to spend my summer improving animint2. I’m especially interested in writing and editing documentation. But I’m comfortable doing whatever has priority.
Of course, my super top secret reason for doing this is so I can maybe eventually publish a paper with Toby and bump my Erdős number down to a 4. But shhhh. That’s just between you and me.
Here’s my repository. It has my .qmd file, if you’d prefer to look at that or knit it yourself. Unless you also use the accompanying CSS file, there may be slight aesthetic differences between your rendered HTML file and this website.
Lastly, there’s been an explosion of AI tools this year. I hereby certify that I haven’t used them for any of my writing or code. In fact, I haven’t used them at all.
All right. Onto the tests.
Easy Test: Personalities By Country
The easy test asks us to do an exercise from the animint2 Manual. Or,
Even better: use animint2 to visualize some data from your domain of expertise.
So let’s take a look at some psychometrics.
Data Wrangling
Many psychological datasets have strict rules regarding their use. Luckily, The Open-Source Psychometrics Project has graced us with an abundance of personality data. I’ve elected to use the Big Five dataset. The dataset has data on participants’ age, race, and gender (among other things). But for the purposes of this test, I’ll limit myself to item responses by country and drop the other data:
The Big Five is otherwise known as the five-factor model of personality.
How many countries are there in this dataset, anyway? And what about the number of responses per country?
"(nu" is equivalent to NA.num_country <- b5c |> count(country, sort = TRUE) |>
filter(!(country == "(nu"))
num_country# A tibble: 157 × 2
country n
<chr> <int>
1 US 8753
2 GB 1531
3 IN 1463
4 AU 974
5 CA 924
6 PH 649
7 IT 277
8 MY 247
9 PK 222
10 DE 191
# … with 147 more rowsThat’s a lot of countries, and most of them have very few responses. Generalizability is affected if n is too small, so I’m going to somewhat arbitrarily keep the six countries with the largest sample sizes and drop the rest. Sorry, Italy.
six_countries <- b5c |> filter(country %in% c("US", "GB", "IN", "AU", "CA", "PH"))Lastly, the individual item responses aren’t especially useful to me. So I’m going to generate sumscores for each of the five personality factors and use that instead for the interactive visualization.
Individual items are useful for estimating psychometric networks. But as far as I can tell,
animint2 doesn’t support them.# add id column
plus_id <- rowid_to_column(six_countries, "id") |> rowwise(id)
# generate columns of sumscores
plus_sumscores <- plus_id |>
mutate(extraversion = sum(across(starts_with("E"))),
neuroticism = sum(across(starts_with("N"))),
agreeableness = sum(across(starts_with("A"))),
conscientiousness = sum(across(starts_with("C", ignore.case = FALSE))),
openness = sum(across(starts_with("O"))))
# remove individual items
sumscores <- plus_sumscores |> ungroup() |>
select(id, country, extraversion:openness)And now we have our final dataset:
sumscores# A tibble: 14,294 × 7
id country extraversion neuroticism agreeableness conscientiousn…¹ openn…²
<int> <chr> <dbl> <dbl> <dbl> <dbl> <dbl>
1 1 US 32 19 32 31 31
2 2 US 28 29 31 28 26
3 3 US 26 32 40 26 22
4 4 US 28 32 34 37 35
5 5 US 32 25 37 30 29
6 6 IN 35 19 31 30 30
7 7 US 31 37 33 35 37
8 8 US 29 33 27 32 33
9 9 IN 32 28 37 34 34
10 10 US 30 29 32 33 31
# … with 14,284 more rows, and abbreviated variable names ¹conscientiousness,
# ²opennessBig Five Data Viz
Now that our data are cleaned, let’s explore.
| Code | Country |
|---|---|
| AU | Australia |
| CA | Canada |
| GB | United Kingdom |
| IN | India |
| PH | Philippines |
| US | United States |
We have five personality traits and six countries. How do personality traits vary by country?
# limit redundancy
violinize <- list(geom_violin(
  draw_quantiles = c(0.25, 0.5, 0.75)),
  coord_flip(),
  labs(x = NULL))
oc <- sumscores |>
ggplot(mapping = aes(x = country,
y = openness))
oc + violinize
cc <- sumscores |>
  ggplot(mapping = aes(x = country,
                       y = conscientiousness))
cc + violinize
ec <- sumscores |>
  ggplot(mapping = aes(x = country,
                       y = extraversion))
ec + violinize
ac <- sumscores |>
  ggplot(mapping = aes(x = country,
                       y = agreeableness))
ac + violinize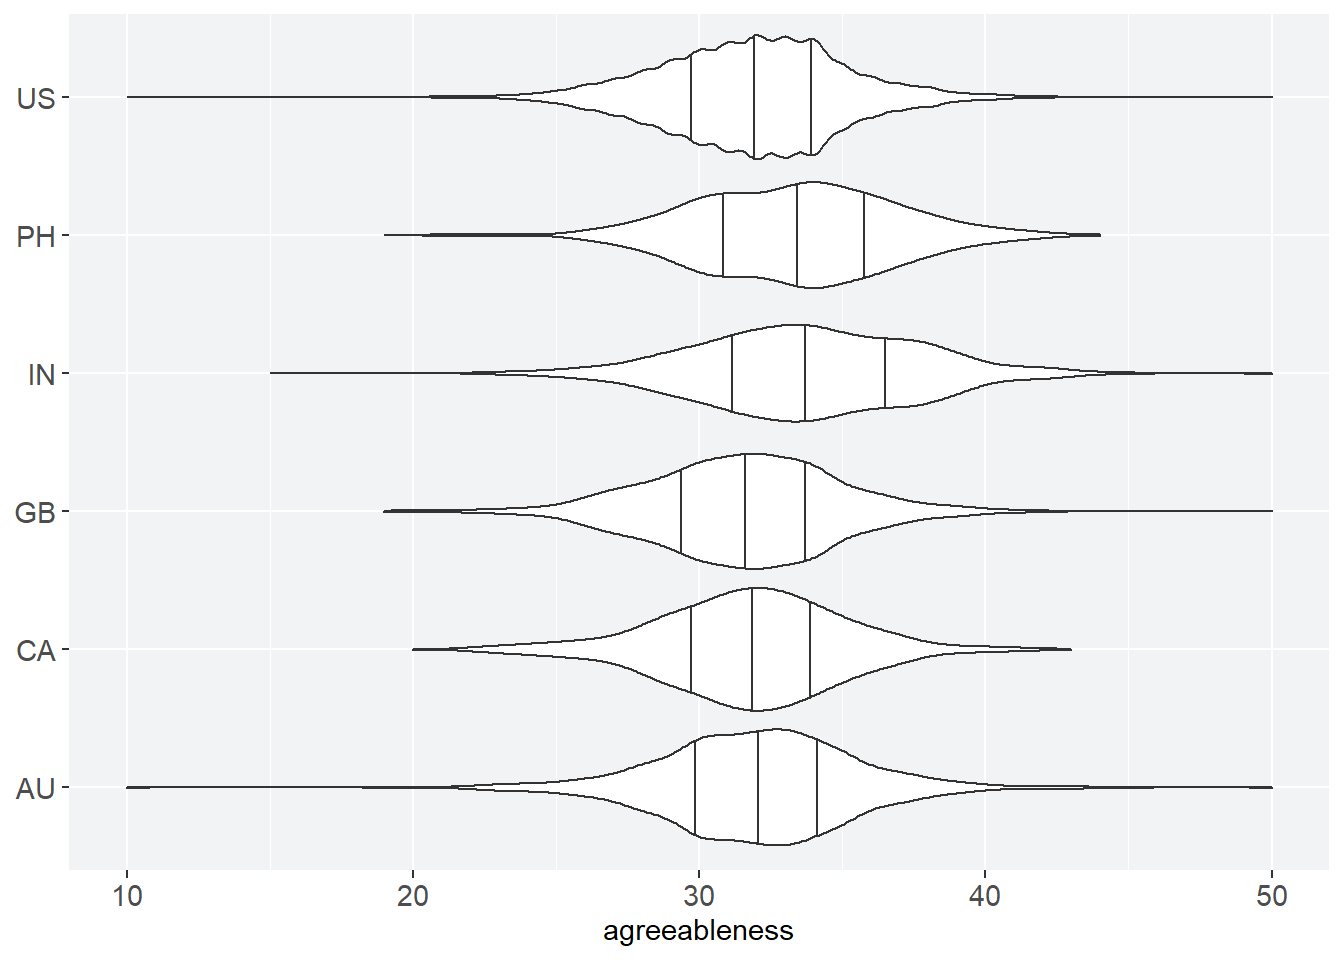
nc <- sumscores |>
  ggplot(mapping = aes(x = country,
                       y = neuroticism))
nc + violinize
There’s some limited differences between personality factors. The distribution of scores for neuroticism is unusually wide, and openness seems to be slightly higher than the other personality factors. I’m not sure why. Maybe it’s an artifact of the kinds of people attracted to the website. Personality science isn’t my specialty in psychology—I can only speculate.
It’s also impressive how similar the scores are between countries. Their median scores do not seriously differ.
Here’s another look at at the similarities between test scores: a density plot for agreeableness. In this plot, we can see the literal overlap between the distribution of test scores. I’ll come back to the inter-country overlap later.
Agreeableness refers to phenomena like the tendency for compliance and altruism.
a_density <- sumscores |>
  ggplot(mapping = aes(x = agreeableness,
                       color = country,
                       fill = country)) +
  geom_density(alpha = 0.1)
a_density
Interacting with Personality
All right. Time for the most relevant part of the test: using animint() to showcase my data.
The factors in the five-factor model of personality are meant to be mostly independent from one another.2 That partly means we don’t expect the factors, when plotted against one another, to have any particularly strong relationships. In contrast, if we obtain a Pearson’s r close to 1 or −1, it may be the case that the two factors are actually one.
2 There are empirical and theoretical reasons to question this, but that’s outside the scope of the test. For further reading, see:
- D. Borsboom. The attack of the psychometricians. Psychometrika. 2006.
- D. van der Linden et al. The general factor of personality. J. Res. Pers. 2010.
What do the data show?
correlations <- sumscores |>
  ggplot(mapping = aes(x = conscientiousness,
                       y = extraversion,
                       color = country))
corr <- correlations + geom_jitter(alpha = 0.25)

ani_corr <- animint(corr)
ani_corr$first <- list(country = "US")
ani_corr
mapping: x = conscientiousness, y = extraversion, colour = country, showSelectedlegendcolour = country
geom_point: na.rm = FALSE
stat_identity: na.rm = FALSE
position_jitter
Here, extraversion is plotted against conscientiousness. The United States is the only country currently plotted. Clicking on other countries plots their data and shows that aforementioned overlap between countries. I’ve also made the data points semi-transparent so the data density is visible.
Extraversion refers to phenomena like outgoingness, while conscientiousness refers to phenomena like diligence.
I haven’t bothered to do any statistics. But at first glance, it seems like these data are consistent with the five-factor model. Outliers distort our hypothetical regression line and render \(r > 0\), but if we zoom in where the data are most dense, perhaps even that fluke of a pattern will fade.
Let’s see if that’s true.
corr_densed <- corr +
  xlim(20, 40) +
  ylim(20, 40)

ani_corr_zoom <- animint(corr_densed)
ani_corr_zoom$first <- list(country = "PH")
ani_corr_zoom
mapping: x = conscientiousness, y = extraversion, colour = country, showSelectedlegendcolour = country
geom_point: na.rm = FALSE
stat_identity: na.rm = FALSE
position_jitter
This time I’ve opted to show the Philippines, the country with the sparsest data. The data do seem to be pretty patternless. Furthermore, as you add more countries—or just the United States—the discrete nature of the data becomes visible even with jittered points. (The sumscores can only be integers.)
Of course, it’s immediately obvious without jitter. In the following heatmap, we can see both the discreteness and distribution of the data. However, generating the heatmap is not as straightforward as generating a scatterplot. First, we need to generate all combinations between the extraversion and conscientiousness factors. Then we need to count them:
Thanks to Toby Dylan Hocking for the suggestion to use a heatmap here!
combo_tbl <- sumscores |>
  select(extraversion, conscientiousness) |>
  expand_grid(.name_repair = "minimal")

von_count <- combo_tbl |>
  group_by(across(extraversion:conscientiousness)) |>
  count()
Finally, we can generate our heatmap:
corr_discrete <- von_count |>
  ggplot(mapping = aes(x = conscientiousness,
                       y = extraversion,
                       fill = n)) +
  geom_tile() + coord_fixed()
corr_discrete
Pretty cool! Being able to explore and present this kind of research would be harder without the interactive benefits of animint2.
Sibling Rivalry
The second part of the easy test asks me to
Show an example of an error that you see when animint2 is loaded/attached at the same time as standard ggplot2.
There’s no conflict with just loading the packages:
library(animint2)
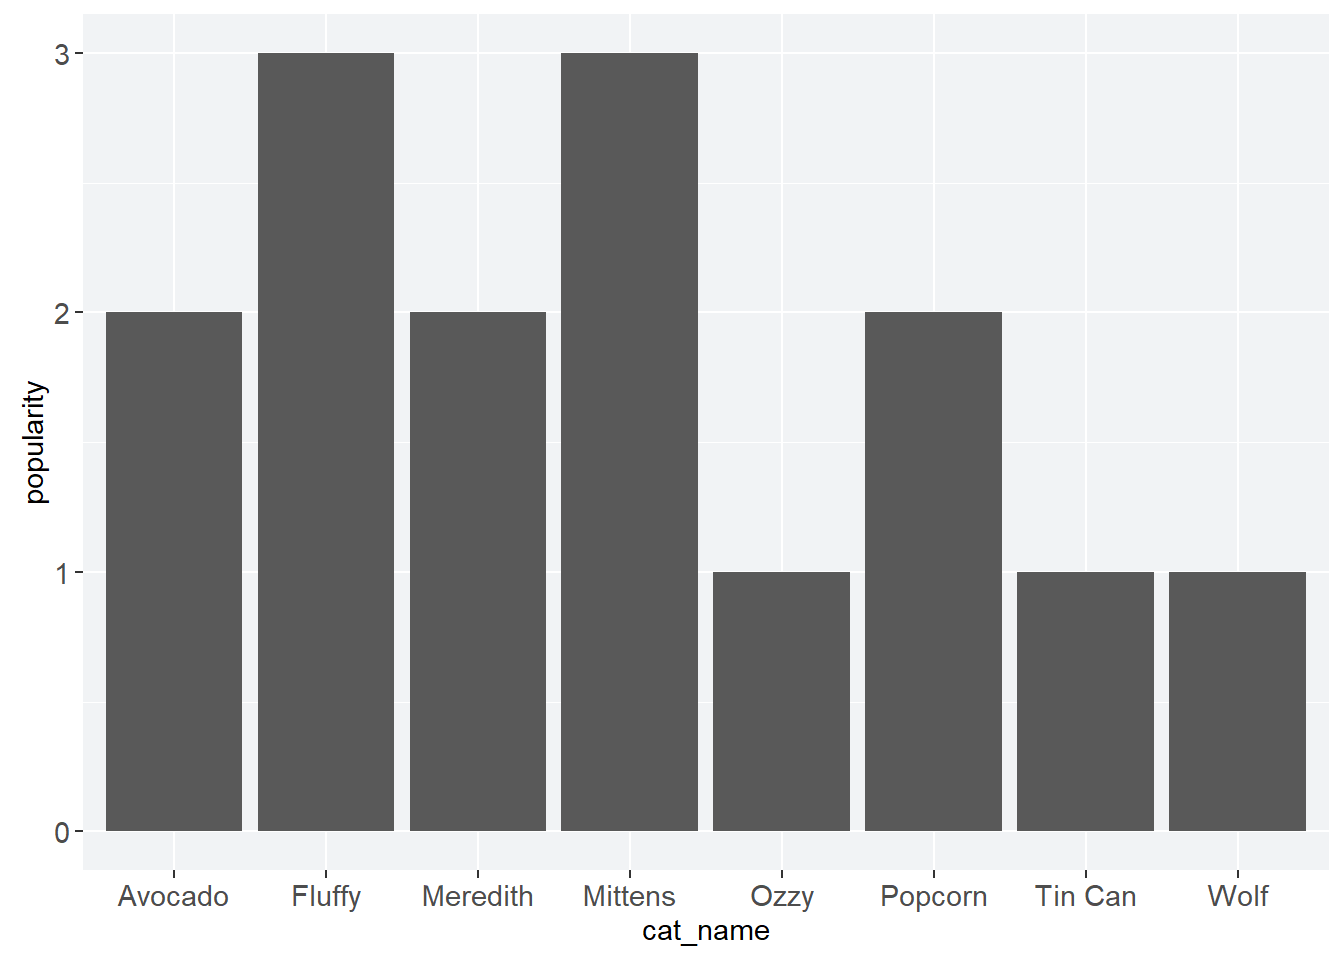
library(ggplot2)But R throws up an error message when you run code that uses syntax common to both. As a quick example, I’ll load up a toy dataset and try to generate a bar chart.
cat_pop <- read_csv("meow.csv",
                    show_col_types = FALSE)

cat_bar <- ggplot(data = cat_pop,
                  mapping = aes(cat_name, popularity)) +
  geom_bar(stat = "identity", color = purple)
cat_bar
What happens?
Warning: Incompatible methods ("+.gganimint", "+.gg") for "+"In other words, animint2 and ggplot2 don’t get along because their syntaxes overlap. Unloading or uninstalling one or the other gets rid of the problem and finally gives us our very important kitty bar chart.
Medium Test: The Law of Large Numbers
There are multiple medium tests. The first one requires that the test-taker
translate an example of the animation package into an Animint.
So let’s look at the law of large numbers (LLN).
About the LLN
The law of large numbers, also called the weak law of large numbers, was named by S. D. Poisson in an article published in 1835.3 He wrote, emphasis his, that
3 Translated from French by I. Hacking, in Chapter 12 of The Taming of Chance. 1990.
Some sources cite Poisson’s 1837 book as the origin of the LLN’s name. Not quite. In his 1835 article, he mentions “la loi des grands nombres”—the law of large numbers.
Things of every kind are subject to a universal law that we may call the law of large numbers. It consists in this: if one observes a very considerable number of events of the same kind, depending on causes that vary irregularly, that is to say, without any systematic variation in one direction, then one finds that the ratios between the numbers of events are very nearly constant.
Though Poisson named it, the LLN has its origins in a posthumous publication by Jacob Bernoulli over a century earlier, and it has continued developing even up to the twentieth century.4 The exact details of the law have changed over the centuries. For our purposes, those details are largely irrelevant. (Also, I know my limits—there’s no way I can explain the LLN in a manner satisfactory to a mathematician.) Instead, we’ll be thinking of the LLN like this: given some population mean and some sample mean, the sample mean approaches the population mean as the sample size increases.
4 Some histories:
- M. Denker. Tercentennial anniversary of Bernoulli’s law of large numbers. Bull. Am. Math. Soc. 2013.
- E. Seneta. A Tricentenary history of the Law of Large Numbers. Bernoulli. 2013.
Importantly, that’s how the LLN animation demonstration interprets the LLN as well. I’ll construct my function with this understanding of the LLN in mind.
Function Construction
The lln.ani function has useful defaults for all its arguments. That’s a good goal to have—a user should be able to run the LLN function without any arguments and produce something useful to teach with.
Let’s call the animint2 LLN function fn_lln. To work, fn_lln requires
- The ability to read some set of data;
- The ability to generate the population mean for that data;
- The ability to continuously sample from the aforementioned dataset and generate sample means, as well as a way to make it stop; and
- A plot that visually indicates the population mean, updates n as it increases, and graphs out the sample means.
Furthermore, though this isn’t necessary for the function to work, I want fn_lln to output messages that are useful for someone who’s unfamiliar with R. I’ll use the assertive package to do this instead of relying on base R’s functions, which sometimes outputs arcane error messages.
I could also write my own error messages, but I like
assertive’s, and code with my own error messages would be messier.The first requirement is straightforward. The dataset needs to take the form of a numeric vector that contains at least one number and no NAs. If a user tries to use something else, fn_lln should throw up an error. I’ll call the vector data_vector:
validity_check <- data_vector |>
  assertive::assert_is_numeric() |>
  assertive::is_non_empty() |>
  assertive::assert_all_are_not_na()
The second requirement is also straightforward. I can just calculate data_vector’s mean—by definition, it’s the population mean.
population_mean <- data_vector |> mean()The third requirement is more complicated. I need to allow the user to decide on the sample size, as well as how often data_vector is sampled from. I need to take multiple samples, each one larger than the other, and calculate sample means from them. Then I need to place those calculations into a dataframe to use later on.
The sampling argument lets fn_lln know the maximum sample size, as well as how often data_vector should be sampled. A for loop does the sampling, and then sample_df stores both n and the sample means as a dataframe.
# create empty vector to put sample means into
sample_means <- vector(mode = "numeric",
                       length = sampling)

# random sampling and mean generation
for (i in 1:sampling) {
  sample_means[i] <- data_vector |>
    sample(size = i, replace = TRUE) |>
    mean()
}

# generate n and a df to use for animint
sample_df <- sample_means |>
  data.frame() |>
  tibble::rowid_to_column(var = "n")
The fourth requirement takes our population mean and sample means and constructs an animated plot that showcases the LLN.
# make lln plot
lln_plot <- sample_df |>
  ggplot() +
  aes(x = n, y = sample_df$sample_means) +
  labs(y = ylab) +
  geom_point(showSelected = "n", colour = "red") +
  geom_line(alpha = 0.5) +
  geom_hline(yintercept = population_mean,
             colour = "red")

# animate lln plot
ani_lln_plot <- animint(lln_plot)
ani_lln_plot$time <- list(variable = "n", ms = 75)
ani_lln_plot
As mentioned, I also want useful defaults for fn_lln. Let’s have data_vector load a pseudo-random sample of six-sided dice rolls by default.
d6 <- sample(x = 1:6, size = 500, replace = TRUE)The final function looks like this:
fn_lln <- function(data_vector = d6,
                   sampling = 500,
                   ylab = "sample mean"){

  # default data_vector
  d6 <- sample(x = 1:6, size = 500, replace = TRUE)

  # make sure dataset is a numeric vector
  validity_check <- data_vector |>
  assertive::assert_is_numeric() |>
  assertive::is_non_empty() |>
  assertive::assert_all_are_not_na()

  # calculate population mean
  population_mean <- data_vector |> mean()

  # create empty vector to put sample means into
  sample_means <- vector(mode = "numeric",
                         length = sampling)

  # random sampling and mean generation
  for (i in 1:sampling) {
    sample_means[i] <- data_vector |>
      sample(size = i, replace = TRUE) |>
      mean()
  }

  # generate n and a df to use for animint
  sample_df <- sample_means |>
    data.frame() |>
    tibble::rowid_to_column(var = "n")

  # make lln plot
  lln_plot <- sample_df |>
    ggplot() +
    aes(x = n, y = sample_df$sample_means) +
    labs(y = ylab) +
    geom_point(showSelected = "n", colour = "red") +
    geom_line(alpha = 0.5) +
    geom_hline(yintercept = population_mean,
               colour = "red")

  # animate lln plot
  ani_lln_plot <- animint(lln_plot)
  ani_lln_plot$time <- list(variable = "n", ms = 75)
  ani_lln_plot

}
fn_lln in Action
All right. Before we get started: after you’ve finished looking at an animated plot, I recommend hiding the selection menu that corresponds to that plot. Otherwise, if you use Firefox, it’ll be difficult to read the rest of this examination.
See the scrolling bug issue for more details.
First, let’s look at what fn_lln produces by default:
fn_lln()The bold red line is the population mean. The grey lines graph the sample means as they converge towards the population mean. The red dot moves when n changes. Pausing the animation lets you change n and move the red dot, allowing you to see how close or far the sample mean is to the population mean at some particular sample size.
Next, we’ll look at what happens when a user uses one argument but not the others. Recall that the three default arguments are data_vector = d6, sampling = 500, and ylab = "sample mean".
Let’s replace data_vector with a pseudo-random sample of twelve-sided dice rolls:
d12 <- sample(x = 1:12, size = 250, replace = TRUE)

fn_lln(data_vector = d12)
Now, let’s replace sampling. We’ll sample d6 250 times instead of the default 500:
fn_lln(sampling = 250)We can also just replace the label for the y-axis via ylab:
fn_lln(ylab = "average dice rolls")Finally, let’s take a look at using all three arguments. We’ll use actual empirical data for this: neuroticism sumscores in our previously-used Big Five dataset. And we’ll sample from those sumscores 800 times.
Neuroticism refers to phenomena like vulnerability to psychological stress and poor emotional stability.
fn_lln(data_vector = sumscores$neuroticism,
       sampling = 800,
       ylab = "neuroticism")
fn_lln seems to work great!
Differences between fn_lln and lln.ani
There are some obvious differences between fn_lln (our LLN function for animint2) and the lln.ani function in animation.
The most important difference is that the latter builds the plot and draws its data iteratively. Each animation is a series of plots, with each being added on top of the next. Try running animation::lln.ani(). You’ll see that it produces 50 plots and flips through them like a flipbook.
In contrast, fn_lln produces the entire plot and line chart before animating the red dot. It produces one plot and updates it continuously. There’s also a minor interactive element that lln.ani lacks.
This is not to say that fn_lln is worse or better than lln.ani. It’s just that translating animation’s LLN function is similar to translating a natural language—meaning is lost and meaning is gained. Regardless of its fidelity to lln.ani, I hope fn_lln will be of some use to statistics teachers and users.
Appendix: Observations
Here are some things that I noticed while reading the documentation and playing around with the package. Since I’m new to animint2, I make no claim that my observations are novel, noteworthy, or even correct. But I think they’re still useful. My guess is that many users of animint2 are also “new” to it, in the sense that they’re working scientists whose goal is to generate an interactive graphic and then to stop thinking about the package. Maybe some of my (possibly mistaken) observations overlap with theirs.
Thoughts
I know that animint2 is a fork of ggplot2, not an extension. But the family resemblance between animint2 and ggplot2 is sometimes confusing. For a short while, I admit that I treated the former as if it were an extension of the latter. I tried to use geom_col() and then geom_boxplot() before checking the reference manual and realizing they were not part of animint2. I also foolishly tried to use packages that depend on ggplot2. Since I had animint2 loaded instead, that obviously didn’t work.
Fun fact: I recently realized that the second edition of the
ggplot2 book mentions animint.ggplot2 documentation is available as a website, but animint2 documentation is only available as a PDF. Of course, there’s the valuable animint2 Manual. But that’s more like a book than a reference site—something like a counterpart to the ggplot2 book. Since the ggplot2 reference was a lot more accessible, I found myself using their reference and only going back to the animint2 reference when necessary.
Grumpy aside: why are PDFs R’s default documentation format? It’s the same with \(\LaTeX\), but at least there’s an obvious technical reason for that.
I’m not sure if I’ll have enough time, and I’m not sure it’s what you mean when you wrote that animint2 will “have even more… documentation.” But as part of that documentation boost, I’d like to generate a reference site for the unique features of animint2. I think that’d make the package more accessible to animint2’s users.
Possible Bugs?
Here’s a list of animint2’s unexpected behaviors. My mistaken observations are probably most concentrated here. It’s possible that the unexpected behavior is not the fault of animint2, but instead the fault of another package or user error. Honestly? Probably user error.
Chapter 7 of the
animint2Manual is buggy and scrolls up by itself. The effect begins happening around this sentence: “Note how we usedgeom_segmentinstead ofgeom_bar, but their appearance is similar.”It’s difficult to lay out multiple plots in a grid, or on a line. Quarto will not knit them properly. My workaround is to have a codeblock for each graph. There’s an open issue about it for
animint, but not foranimint2. So I’m not sure if it’s still a problem, or if I messed up somehow.When I tried to make an interactive density plot, I was warned that “
showSelecteddoes not work withStatDensity.” Items in the legend are selectable, but selecting one removes the density curve currently on screen. The end result is that only one curve shows at a time. I haven’t been able to find documentation about this anywhere.When I make interactive scatterplots, I’m warned that “
showSelectedonly works withposition=identity, problem: geom1_point_foobar.” This is confusing, since:- It’s already the case that
position = identity, since it’s the default forgeom_point()andgeom_jitter(). - The problem it points out is the
.tsvfile thatanimint()generates. - It correctly renders the scatterplot.
- It passes
testthat::expect_no_warning()and failsexpect_warning(), despite the fact that it outputs a warning.
- It’s already the case that
When I make violin plots, I’m warned that the graph is “collapsing to unique ‘x’ values.” This has been fixed in
ggplot2but not inanimint2, possibly since the fix happened after the fork. (I’m least certain about this observation.)When I try to place a static
animint2graph in the margins, I can’t place a caption, or else the graph doesn’t render correctly.column: marginandfig-capdon’t work well together.When I try to use
geom_bin2d(), I’m informed that “bin2dis not supported inanimint. Try usinggeom_tile()and binning the data yourself.” But theanimint2reference mentions that it does supportgeom_bin2d.When I use
geom_raster(),animint2correctly renders it as a static graph. But it will not render the data or the legend when I useanimint2. This is documented.When I use
geom_hex, I’m warned that there is “no data in geom1_hex_foobar.”It is not possible to plot a normal distribution in
animint2without specifying any dataframes or tibbles. However, you can do so inggplot2. This is not a bug, but I figured it should be noted.
Only in Firefox. Technically not about
animint2 itself, but it’s animint2 adjacent.Possible Ways to Get Around Problems
- In
ggplot2, it’s possible to plot a normal distribution without any specifying any dataframes or tibbles. This is not the case foranimint2. The obvious solution is to specify a dataframe or a tibble:
# works only in ggplot2
norm_distr <- ggplot() + xlim(-5,5)
norm_distr + stat_function(fun = dnorm)

# works in animint2
norm_distr <- ggplot(data.frame(x = c(-5, 5)), aes(x)) +
stat_function(fun = dnorm)- In Chapter 7 of the
animint2Manual, and for other webpages with animints, the page automatically scrolls up in Firefox. Fixes can be found in the scrolling bug issue in theanimint2repository.
Appendix: My Mistakes
Major mistakes I made while doing these tests and then subsequently caught. This excludes mistakes re: the number of brackets, the placement of a function, or spelling.
Easy Test
My sumscores were erroneous, but it took me an embarrassingly long time to notice and check. I first noticed that the openness sumscores were impossibly high—each sumscore has a ceiling of 50, which openness sumscores exceeded. Manually adding up the scores myself showed that extraversion had errors, too. I believe my mistake was using c_across() and then messing up the selection syntax, but I didn’t really have the time to experiment and check.
I took a long time figuring out the details of the heatmap. The code is straightforward, but that is the result of a long process of experimentation. Most of this was because I was unfamiliar with both heatmaps and the functions necessary for combinatorics (e.g. I was unaware of expand_grid()). It was a good learning experience.
Medium Test
Here’s what my for loop does. First, it samples a datum and produces the mean, which is just the datum itself. Then it replaces that datum, samples 2 data points (with replacement), and produces a mean. Then it samples 3 data points, then 4, and so on until the function tells it to stop.
My initial for loop didn’t do that. I first noticed that my sample means didn’t seem to be converging as the LLN said it would. Then I noticed a much more obvious problem: d6 consists solely of integers, so why was the first mean not an integer as well? Something was clearly wrong.
Eventually, I figured out that sample() was missing its size argument. I set size = i and got the loop to work. Lesson learned: if there’s a bug, check your arguments!